
GHG Emissions

Greenhouse gases (GHGs) are the root cause of anthropogenic climate change. Carbon Dioxide (CO2) is the most common greenhouse gas. Other GHGs include Methane, Nitrous Oxide, and other gases that trap heat and cause warming. Different GHGs have different potencies for trapping heat in the atmosphere, so GHGs are quantified as Carbon Dioxide equivalents (CO2e), as shown in the graph below.
Western is committed to reducing our emissions in line with the International Paris Accords of 2016, and Ontario's provincial goals, in an effort to prevent global temperature increase of 1.5ºC. Specifically, our goals are:
- By 2030 - reduce greenhouse gas emissions by at least 45%, relative to 2005 levels
- By 2050 - achieve net-zero emissions for campus operations
Western has been continuously growing for many years to provide a world class learning and working environment for the campus community. In spite of its growth, Western's emissions have reduced since 2005. Due to our carbon reduction efforts, we have reduced emissions per square foot. Looking to the future, we plan to not only reduce our emissions per square foot, but also to reduce our overall Adjusted Scope 1 emissions. Significant gains in Scope 2 emissions are related to the phase-out of coal in Ontario's electrical grid.
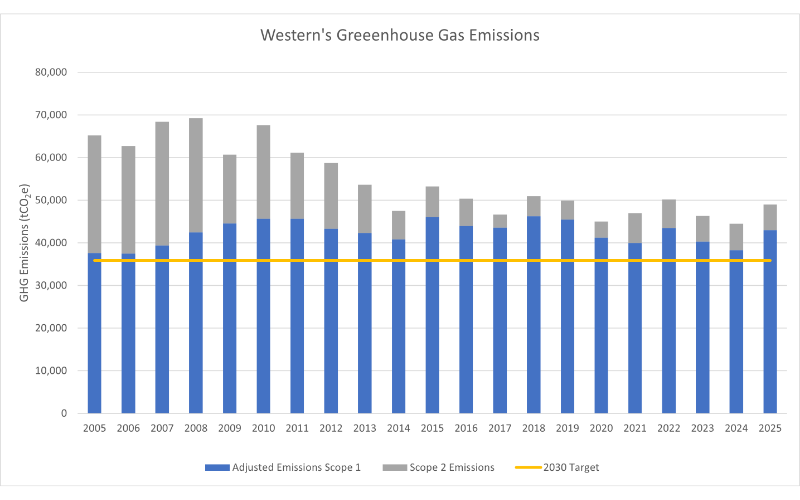
Note: Adjusted Scope 1 Emissions refer to GHG emissions directly related to fuel combustion for Western operations. Notably excluded are emissions attributed to steam consumption at London Health Science Centre's University Hospital (UH).
|
Year |
Adjusted Emissions Scope 1 |
Scope 2 Emissions |
Total (CO2e) |
| 2005 | 37,609 | 27,600 | 65,209 |
| 2006 | 37,516 | 25,182 | 62,698 |
| 2007 | 39,399 | 28,977 | 68,376 |
| 2008 | 42,454 | 26,815 | 69,269 |
| 2009 | 44,521 | 16,157 | 60,678 |
| 2010 | 45,651 | 21,930 | 67,581 |
| 2011 | 45,690 | 15,429 | 61,119 |
| 2012 | 43,293 | 15,442 | 58,734 |
| 2013 | 42,314 | 11,298 | 53,612 |
| 2014 | 40,829 | 6,658 | 47,487 |
| 2015 | 46,070 | 7,197 | 53,267 |
| 2016 | 43,960 | 6,418 | 50,378 |
| 2017 | 43,589 | 3,023 | 46,612 |
| 2018 | 46,267 | 4,662 | 50,929 |
| 2019 | 45,461 | 4,419 | 49,880 |
| 2020 | 41,225 | 3,754 | 44,979 |
| 2021 | 39,960 | 7,022 | 46,981 |
| 2022 | 43,486 | 6,686 | 50,172 |
| 2023 | 40,284 | 6,005 | 46,289 |
| 2024 | 38,279 | 6,176 | 44,456 |
| 2025* | 42,959 | 6,046 | 49,005 |
*Preliminary
Direct GHGs are known as Scope 1 emissions. These encompass all emissions directly generated from the combustion of fuel on-site, including Western-owned vehicles and on-site combustion of fossil fuels for heating, humidification, and back-up power generation. Western has its own steam power plant on campus which accounts for the majority of our Scope 1 emissions. Scope 2 emissions include any emissions attributed to electricity imported to campus from the electrical grid. In Ontario, the carbon intensity of grid electricity is dynamic. Low-carbon nuclear power is the primary generation source and the balance of power is generated by a mix of renewables and natural gas. There is also a third category of emissions known as Scope 3, which includes all other indirect emissions associated with the university.
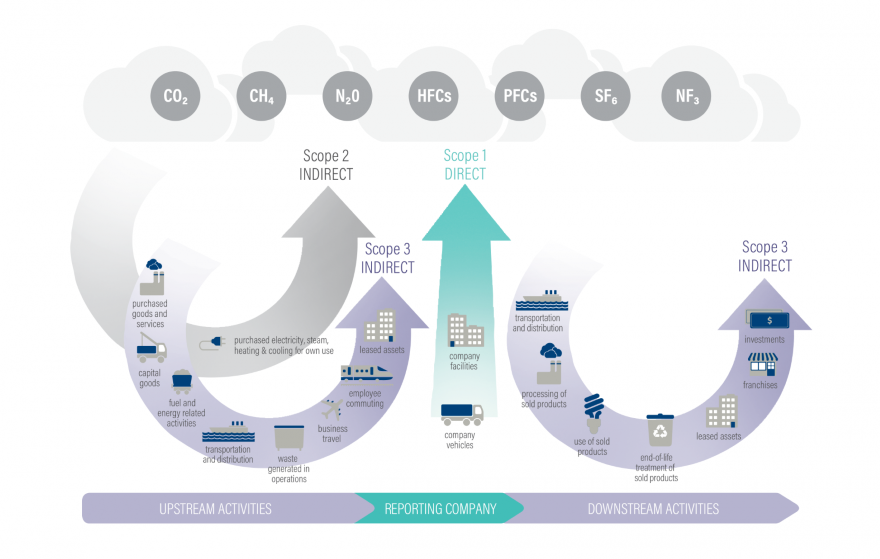
Graphic source: https://www.wri.org/initiatives/greenhouse-gas-protocol
External influences on Western's Scope 1 and Scope 2 emissions:
Heating and Cooling Degree Days
Heating degree days (HDD) reflect the demand for space heating over the course of a year. Since most of Western's Scope 1 emissions are associated with natural gas, used for heating, colder or longer winters typically result in higher Scope 1 emissions, while milder winters reduce emissions.
Ontario Electricity Emission Factor
Western's Scope 2 emissions are also influenced by the emission intensity of Ontario's electricity grid, from which most of Western's electricity is supplied. Ontario's grid is primarily powered by hydroelectric and nuclear generation, resulting in a relatively low emission factor. Over the coming years (through approximately 2034), planned nuclear refurbishments and retirements are expected to reduce nuclear output temporarily. During this period, increased reliance on natural gas generation may lead to a higher electricity emission factor, affecting Scope 2 emissions.
For more information, visit the Independent Electricity System Operator's (IESO) website.